

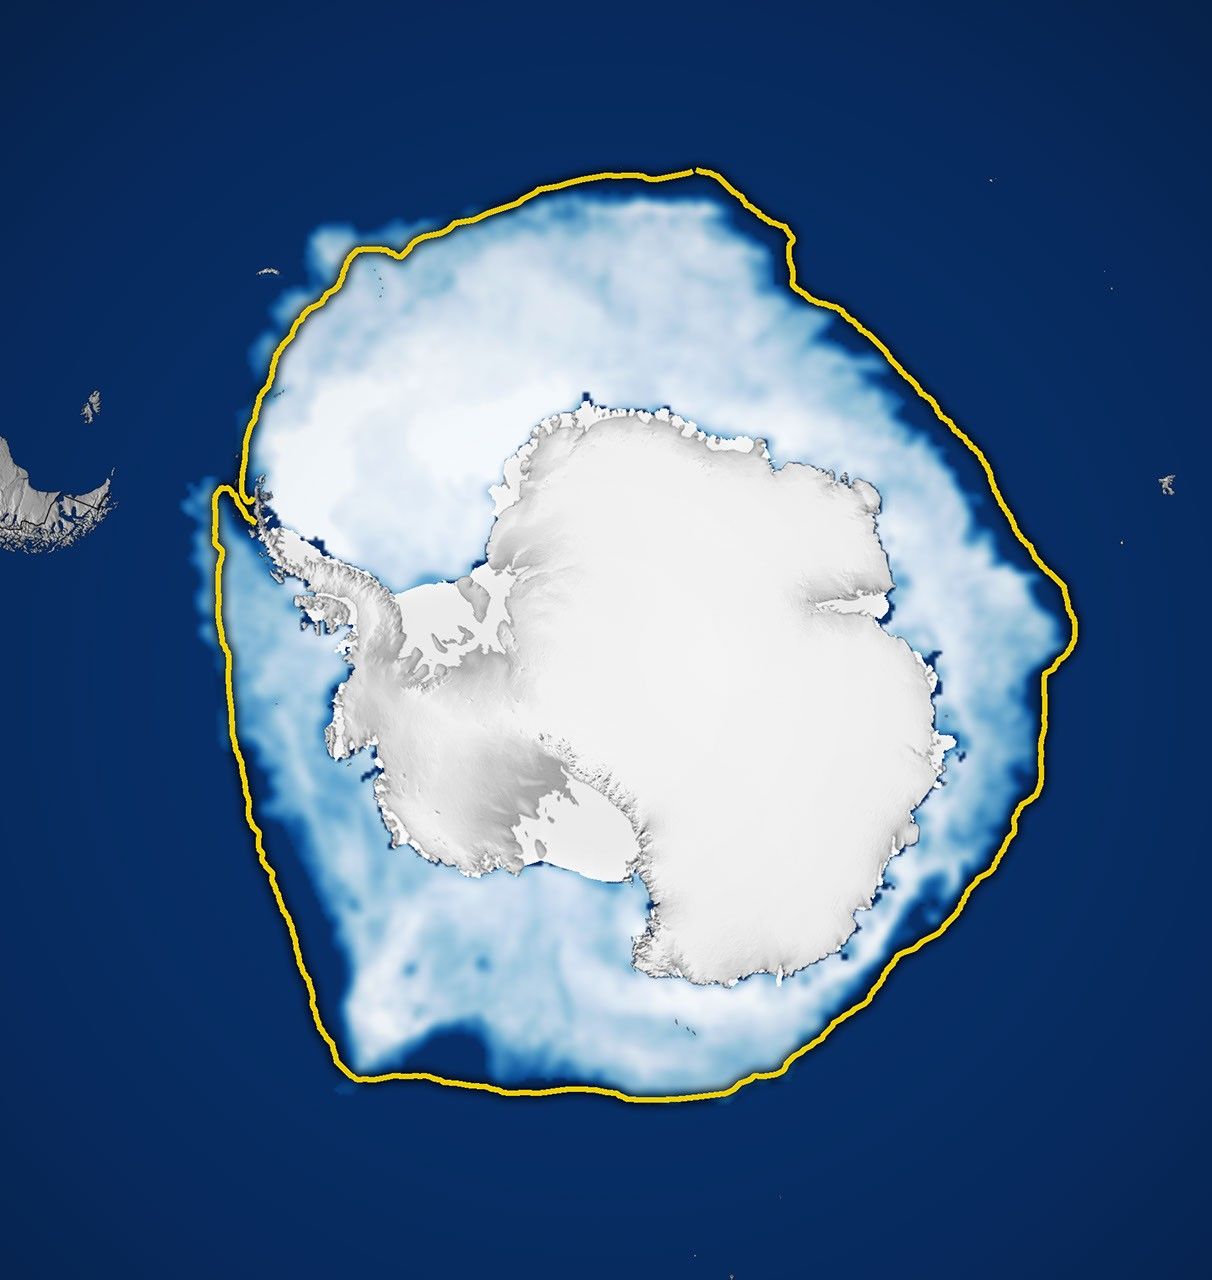
Sea ice around Antarctica reached the third-lowest winter maximum in 2026 since continuous satellite observations began in 1979. The ranking appears both in the analysis released this Monday (12) by NASA, with data from the National Snow and Ice Data Center (NSIDC), and in the independent tracking by Japan’s National Institute of Polar Research (NIPR).
NASA and NSIDC estimate that coverage reached 17.59 million square kilometers on September 14. The figure considers as “extent” all ocean areas where at least 15% of the surface was covered by ice. After this peak, coverage began to retreat with the arrival of spring in the Southern Hemisphere.
Two methods, the same position in the ranking
The Japanese center NIPR found a peak of 17.71 million square kilometers on September 11. The small difference in date and area does not represent a contradiction: the institute works with five-day running averages, while NASA and NSIDC employ another daily series and their own sensor processing criteria. Both analyses, however, reach the same central conclusion: the 2026 maximum was the third-lowest in 48 years of satellite records.
NIPR’s monthly report also shows that the September average stood at approximately 17.39 million square kilometers, 300,000 square kilometers below the same month in 2025. By late September, the extent had already fallen to levels close to those observed in 2023, the year holding the lowest average value for the month in the institute’s series.
Differences among Antarctic regions
The loss did not occur uniformly around the continent. According to NIPR, the extent was below the 2010s average across most of the Antarctic periphery, with particularly sharp deficits in the Amundsen Sea and the Indian Ocean sector. The Weddell and Bellingshausen seas were exceptions, with ice areas above the regional baseline.
This distribution matters because Antarctic sea ice responds quickly to winds, currents, ocean temperatures, and atmospheric conditions. For this reason, scientists analyze not only the continental total, but also where the ice advanced or retreated during the season.
How satellites measure ice
Measurements use passive microwave sensors. Ice and open water emit different signals in this part of the spectrum, allowing satellites to track coverage even through clouds and during the long polar night. The record began in late 1978 with Nimbus-7 and continued with missions from the United States meteorological program, NASA’s Aqua, and, more recently, the Japan Aerospace Exploration Agency’s GCOM-W satellite.
The method measures the extent of the ocean surface covered by ice, not total volume or thickness. It is also important to distinguish sea ice — ocean water that freezes seasonally — from land ice accumulated over Antarctica.
A recent pattern that requires monitoring
Antarctic coverage has varied widely in recent decades. Between 1979 and 2014, total extent showed a slight growth, with winter record highs between 2012 and 2014. Starting in 2016, however, more pronounced declines began to occur. In 2023, the record registered both the lowest minimum and the lowest maximum.
NASA emphasizes that year-to-year variability around Antarctica is high and that data must continue to be monitored to separate natural fluctuations from a lasting system change. Still, the repetition of low values in recent years reinforces the importance of observing the upcoming melt season and the regional ice distribution.